How do you model your revenue plan during a global crisis?
We’re not in normal times right now. Your sales forecast and previous funnel models are going to be wrong. You need to pressure test every deal in your CRM. You need to test your model.
How do you plan for next quarter? In normal times, you’ll hear sales leaders talk about needing 4X sales pipeline coverage, or is it 3X coverage, or is it 2X coverage for just the gap? The question is, how much pipeline coverage is actually needed?
But what do they actually mean when they say it? And how can a sales pipeline coverage model help you when the market is changing?
In a quick poll, most people I talked to simply use a sales pipeline coverage formula of target * 4. But that’s not the best way to do it. In this post, I want to break down what sales pipeline coverage is, how to calculate it using a sales pipeline coverage formula, and how it can be the early indicator that your business is changing (for better or worse).
First, some metrics:
There are 4 key metrics to build your sales pipeline coverage model around, which if you tweak any one of them, your projected revenue number goes up or down. These metrics should be considered for each segment or vertical in your market (i.e. SMB, Mid-Market, Enterprise, Channel).
-
Volume: how many deals are in the funnel?
-
Value: how much are they worth?
-
Velocity: how fast do they move through the funnel/each stage?
-
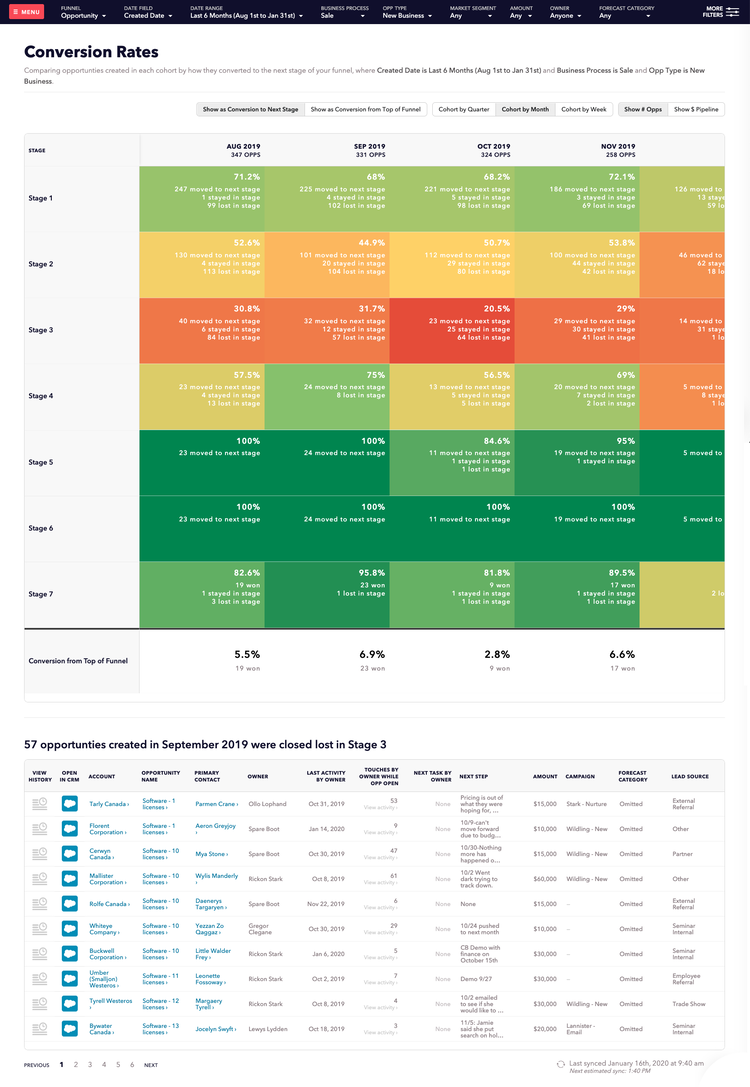
Conversion rates: how many make it through to each stage of the funnel?
If you improve any one of them your sales pipeline coverage changes. You can (and should) build your entire financial model off these numbers. Watching these numbers is the first indicator of your business changing and increasing risk to the model. It is crucial to regularly measure pipeline coverage to understand the distribution of opportunities and mitigate risks effectively.
How to calculate a sales pipeline coverage formula
To calculate pipeline coverage formula, work down your funnel, adding each stage’s output to the next stages opening calculation:
First Stage N = If stage velocity is within close period[(Volume * Value) * Conversion]
Every other stage = N + If stage velocity is within close period[(Volume * Value) * Conversion]
How is sales pipeline coverage different than a forecast or weighted pipeline?
A common misconception is that sales pipeline coverage, weighted pipeline, and forecasts are the same. They are not.
-
Weighted pipeline: Weighted pipeline is a mathematical approach to identify what you can close based on what’s currently in each stage of your funnel. For example, you have $1M in Stage 1, and Stage 1 has a 10% probability, giving you $100,000 in weighted pipeline. Sum this up for every stage, and that’s weighted pipeline. There are a few downsides with this approach discussed below.
-
Forecast: Your forecast is a deal-by-deal assessment of what’s going to close this month or quarter, attributing a subjection assessment of it’s likelihood: commit, best case, optimistic, pipeline, worst case. These get summed up to show what various scenarios look like, but that’s the extent math is involved.
-
Sales pipeline coverage: Your sales pipeline coverage is a mathematical model. It can be used for identifying if you have enough deals to make your number heading into a quarter, gauging the forecast in quarter, and building on your long-term revenue projections through work-back modelling. Utilizing suitable sales technology enables sales and marketing teams to use their pipeline coverage ratio efficiently, ensuring dependable, current outcomes and comprehensive visibility into the pipeline.
Should I rely on a sales pipeline coverage model?
You should always model with one, but relying on a mathematical model for your forecast requires you to get your house in order. Sales managers often use the pipeline coverage ratio as a guiding metric for accurate sales forecasting and ensuring consistent achievement of revenue goals. There are two things that will make coverage predictive:
-
Consistency vs volatility in your performance
-
CRM hygiene
Consistency vs Volatility
If you have a consistent funnel (month over month or quarter over quarter performance) in terms of deal size, velocity, and conversion rates, it's fairly straightforward. Make sure you segment it by the categories that create different value or velocity (i.e. mid-market vs enterprise, or government vs tech)
If you have inconsistent funnel performance (deal sizes swing wildly, conversion rates are unpredictable) you're not going to be able to create an accurate coverage model. Aim for 4x, and then drill into why your funnel is inconsistent to create your company's sales pipeline coverage model.
Deal Hygiene and Pressure Tests
Here's the thing, CRM hygiene – deal hygiene to be specific – is the number one thing that will make or break your model.
If your reps aren't keeping Salesforce up to date, how do you know what's real or what's fake? Your sales pipeline coverage number could balloon by 30-50% because of zombie pipeline. Over the long term, requiring a high sales pipeline coverage ratio to make your number indicates bad system design and bad process enforcement.
Start with the Deal Health System (free ebook).
Cautions on using weighted pipeline:
Weighted pipeline can be effective at scale, but I think the added work of coverage modelling gives you a more accurate picture. Here's an issue that happens, particularly in smaller organizations:
-
You have 10 deals in Stage 1
-
Stage 1 is set to a 10% probability
-
9 deals are worth $10,000, and 1 deal is worth $100,000
-
Based on a weighted pipeline formula, $19,000 would be won – but you don't have a deal worth $19,000. You'll either win 1 deal worth $10k or $100k.
This could come out in the wash if your sales pipeline is large enough (blending by volume) or segmented well (weighted pipeline calculated by segment), but it is still very fuzzy math.
If you're using a weighted pipeline formula, you should design your model by using win rate from stage using recent conversion rates. For example, if Stage 1 is weighted at 10% probability, but your win rate from that stage is 7%, it's going to dramatically skew your numbers. Since stage probabilities in Salesforce aren't segment based, it's going to skew the math.
Another method to get around this is to compare your conversion rates between count moved to next stage and dollars moved to next stage.
Lastly, sales velocity is another popular metric, and it's useful for comparing reps across segments, but again it relies so much on deal hygiene that it can be very unreliable in practice.
Total sales pipeline coverage or gap coverage?
Total sales pipeline coverage looks at the coverage number compared to your target number. It is crucial to maintain a ratio of pipeline value to sales quota to ensure sales targets are met. This is useful for planning, and particularly useful for longer sales cycles for evaluating the health of future quarters that need to be set months in advance.
Gap coverage looks at the coverage number compared your target number, minus your closed won number. Gap coverage is very useful for in-month and in-quarter comparisons to the forecast, and particularly for high velocity sales cycles at any point in time.
We use both, in addition to a sales forecast model, when managing our own business.
Sales pipeline coverage in a crisis
Coverage modelling is a useful exercise because you can tweak your core metrics of volume, value, velocity, and conversion:
-
What happens if we cut our deal size in half – can we make it up in volume?
-
What happens if a specific segment stops buying?
-
What happens if our sales cycles slow down?
-
What happens if deals get stuck in Stage 4 for 2 months due to purchasing freezes?
This will help you be prepared, and it will help you understand when you are coming out of the crisis – because the numbers will change once again. Additionally, accurately calculating pipeline coverage is crucial to ensure revenue targets are achieved.
Should sales reps be held to a sales pipeline coverage target?
Yes and no.
A sales pipeline coverage ratio of 4x is a great guideline for your team, but using it to manage individual contributors will set you up for failure. If reps feel they need to always keep a certain sales pipeline coverage ratio – lets say at 4x – at all times to keep their manager off their back, they will end up keeping bad deals open. They will play kick the can down the road, and you will have zombie pipeline in no time.
This is why you need to develop good habits with your team to keep good CRM hygiene. Providing your sales team with the right tools and metrics can help maintain a healthy pipeline and improve overall performance.
Find the truth in your pipeline, face the scary reality of a shortfall, and then do something about it.