Would you feel confident about making any sort of important decision with only 7% of the data available?
Well, many companies today are doing exactly that, and it’s because conversion rates reports typically look like this:
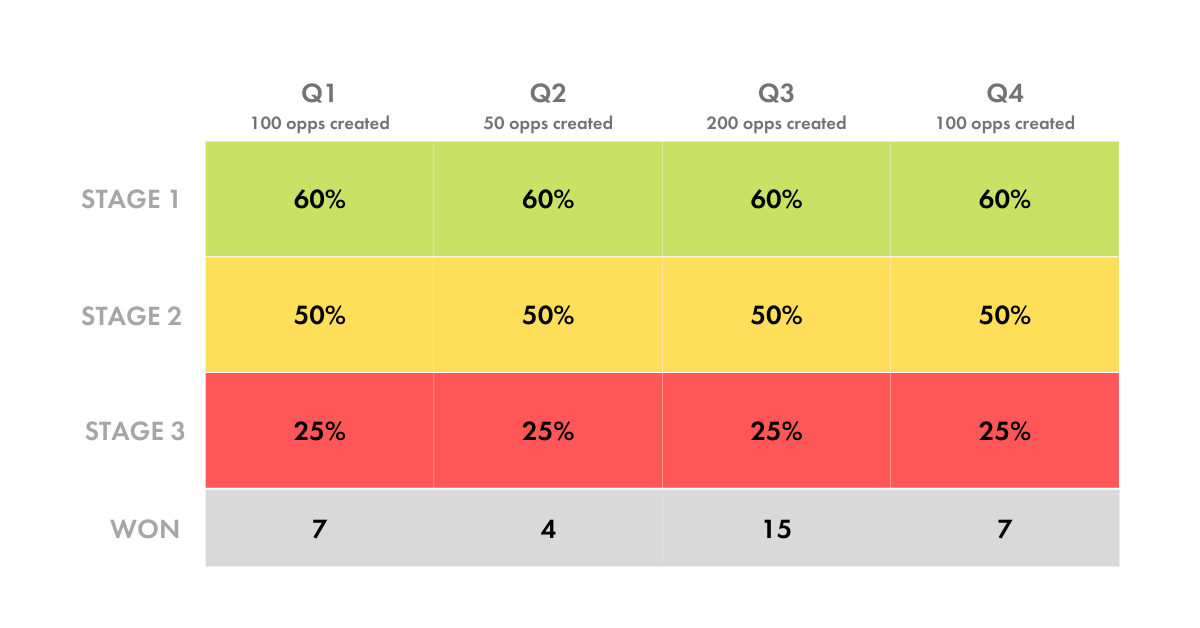
But that’s not a complete picture – it’s actually not even 10% of the picture. Out of the 450 opps being measured, you’re only following the story of the 18 deals that were won, what about the other 432 that got stuck or fell off at each stage?
Finding your failure points
Positive progression is a useful thing to look at to answer some important questions – like how many leads will be generated by investing $X into a certain campaign, and how many of those leads will convert into revenue. It’s also going to show you where your failure points are, but it’s not going to help tell you why they are failure points.
You’re going to start learning “why” by looking at your negative progression, which is the number of opps that get stuck or lost in each stage. Including negative progression in your conversion rates report gives you a complete picture, and allows you to start asking intelligent questions about the data, and work towards fixing the failure points.
Here is what your conversion rate report should look like:
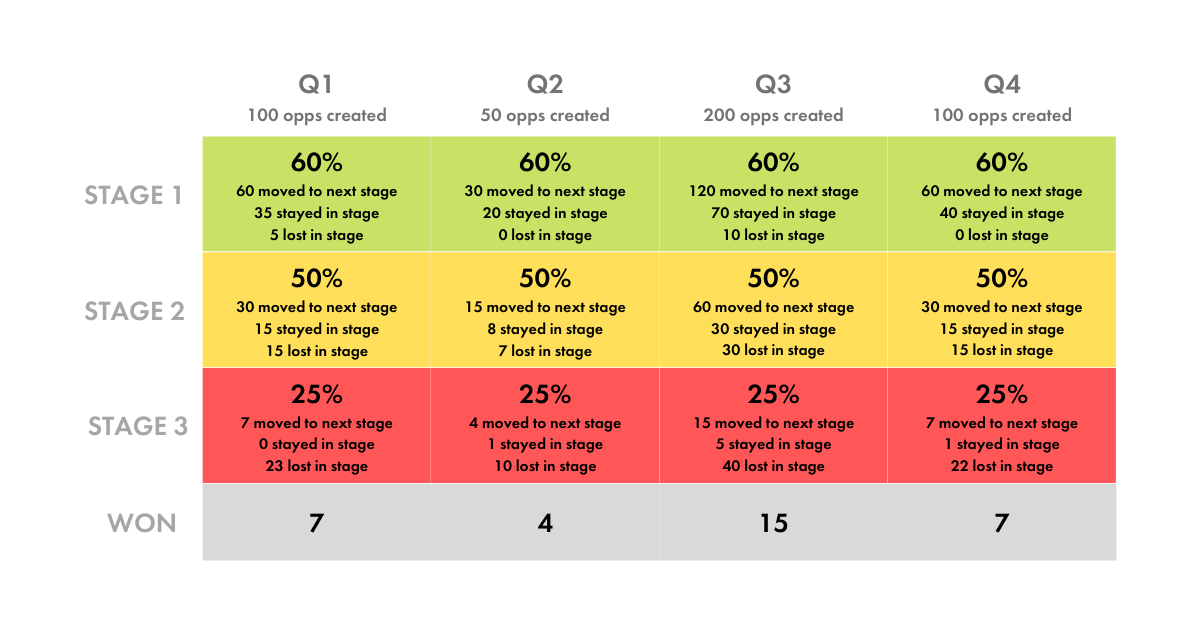
With our updated conversion rates table, you can still see that the same number of opportunities entered the funnel and the same number of deals were won, but we have a much better sense of what happened in each stage.
Stage 1: Opps that don’t move on are stagnating in this stage and being left open – only a small amount are being closed lost.
Stage 2: Of the deals that don’t move forward, it’s about a 50/50 split between opps remaining in stage and being closed lost.
Stage 3: A high percentage of opps are being lost at the bottom of the funnel.
With the additional data available, there are a couple places to start. Either find out why so many opps are getting stuck at the top of the funnel, or why so many are being lost at the bottom.
If we look at the bottom of the funnel, are so many deals being lost because of poor qualification in the earlier stages? Is it because you’re missing a sales asset to overcome a popular objection in this stage? Why?
Let the data be your guide
The reason things get stuck or lost in the funnel are completely different for every company, for every segment, for every stage, and for every rep. There are no best practices on how to improve conversion rates other than to dig into the data, but by measuring your conversion rates holistically you’ll be able to tell where to start.
If opportunities are getting stuck in a stage, the question you want to answer is if they are real opportunities, or if they’re dead deals and should be closed. Here are some questions you can ask of your data:
- When was the last touchpoint?
- How many have a scheduled next step?
- Is the close data accurate?
If opportunities are being lost in a given stage, you’ll want to find out if they’ve received a good sales attempt or not. You can start by asking:
- How many touchpoints happened before they closed?
- How many opportunities were dispositioned to Unqualified vs. Nurture?
- Is there a theme with the “Loss Reason” that could be solved for earlier in the sales process?
Some failure points are solved by creating sales material to overcome certain objections, while others are solved by adding a discovery question to identify unqualified deals earlier in the funnel. Sometimes it’s about changing sales rep behavior – like having them close deals out when as soon as they are dead so they can go into a nurture stream, rather than leave them open in pipeline.
Fixing failure points to create a more predictable funnel
To improve conversion rates, there are two roads to take:
-
fix what’s broken
-
optimize what’s working
It’s always important to take a look at the business and see what’s working – maybe take a second to give yourself a pat on the back – but by fixing what is broken you can make a bigger impact, quicker.
By looking at negative progression, you can start to understand why there are failure points in your funnel by asking questions about the data, and then work to create solutions that will help to make your funnel more predictable.
Once you’ve created a solution for your failure point, move onto the next, and repeat the process.